A key feature in any computing platform is the ability for users to monitor their applications to check performance metrics, possible errors in the deployment, and refactoring/rescaling needs. It is also of great use to be able to create alerting rules to notify them and the refactoring engine when certain conditions are met.
SODALITE natively supports monitoring at different levels: Cloud infrastructure, network, and HPC, and offers developers the possibility to integrate application-level monitoring in their deployments.
Creating the monitoring system for the SODALITE platform presented 3 main challenges:
- Allow the dynamic creation and destruction of heterogeneous monitoring targets
- Keep deployment metrics secure -only available to the application owner.
- Be transparent to the user, so that they only need to worry about their application.
To address these challenges, several components have been developed and deployed in the SODALITE backend.

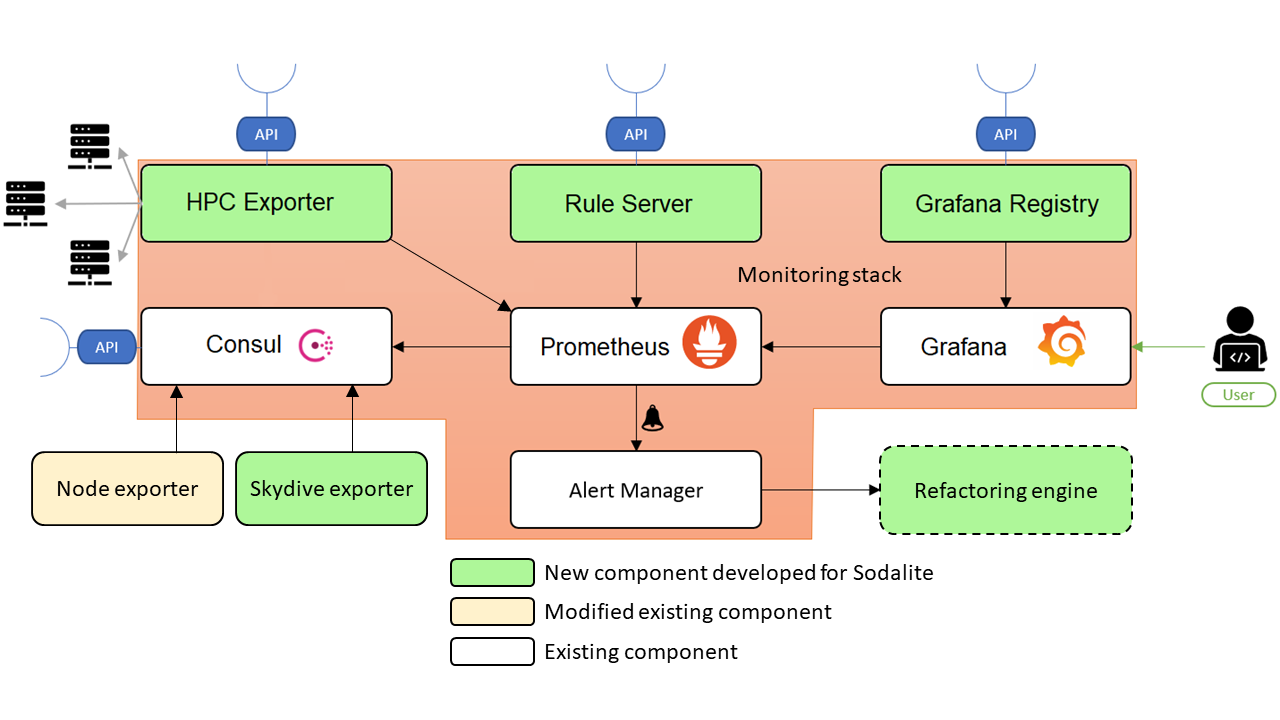
At the heart of the monitoring, stack resides a Prometheus instance, gathering all the metrics from the exporters. There are currently 3 types of exporters natively supported by Sodalite: the node exporter, the HPC exporter, and the skydive exporter. They gather VM metrics, HPC metrics, and networking metrics respectively.
One of the key features of Sodalite is the dynamic creation and deletion of VMs during the deployment process of an application. To support this behavior, an instance of Consul handles the registration of the node and skydive exporters. Every exporter deployed on the platform has associated with them a “monitoring_id” label to identify to which deployment it belongs.
A special case is the HPC Exporter, which has been developed to connect to HPC frontends through SSH to retrieve infrastructure usage and submitted job metrics, all associated with the user’s account on the HPC system. Only one instance of HPC Exporter exists in the Sodalite backend.
The exporter offers an API to allow the creation of collectors associated with deployment and HPC infrastructure, each collector labeled with the corresponding monitoring_id and hpc_label. To secure the user’s credentials used to connect to the HPC infrastructure, the HPC Exporter has been integrated with Vault, where the SSH credentials are kept; and Keycloak, to authenticate the user and enable the collector creation process to be done automatically by the Ansible playbooks offered by Sodalite.
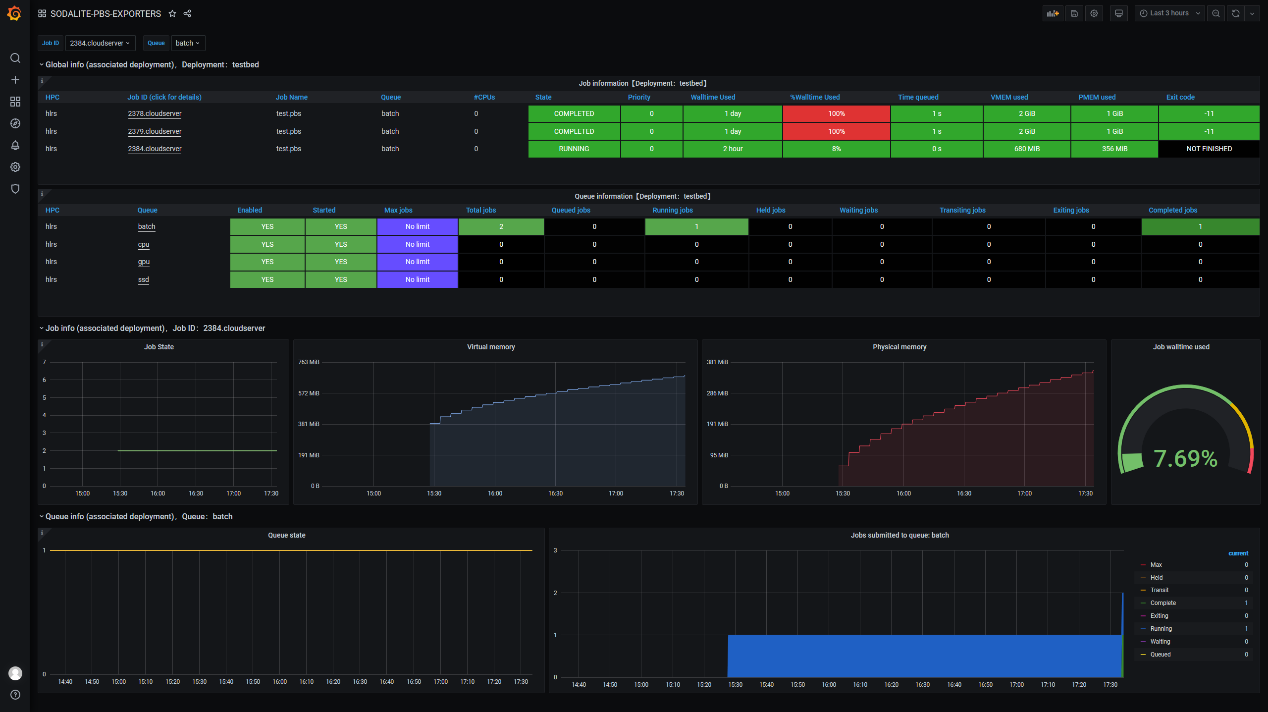
When a user deploys an application through the IDE, they are presented with the Grafana links to the deployment dashboards. After they log in by using their Keycloak credentials, they can visualize their deployments’ metrics. To achieve this seamless transition from deployment to monitoring, the IDE uses Grafana Registry’s API, a new component developed for the Sodalite backend. The Grafana Registry uses custom-made templates to create a set of tailored dashboards for the user’s deployment. It also sets the dashboards’ permissions so that only the owner of the deployment can access them, and finally allows the IDE to retrieve the dashboards’ URLs.

Sodalite also enables the user to create alerting rules and dynamically deploy and delete them. The IDE offers a powerful editor that assists the user in creating a set of rules that will set thresholds for refactoring actions. Once the rules are created they are deployed to Prometheus through the rule server, a new component that has been developed to enable dynamic registration of alerting rules. The Alertmanager, tasked with delivering alerts when they are triggered, is integrated with the refactoring engine, which closes the loop in the continuous monitoring and refactoring cycle.
Next steps
REFIT will have a library that application developers can use to more easily create application-level exporters and integrate them with SODALITE’s stack.
